amChartsは高機能なデータ可視化のためのライブラリです。 チャートやグラフを描く以外にもたくさんの表現ができます。 その中で、Word Cloudという機能があったので使ってみました。
Contents
amCharts 4

利用したライブラリはamCharts 4です。 使った感想はQiitaにまとめましたのでご覧ください。
Word Cloud
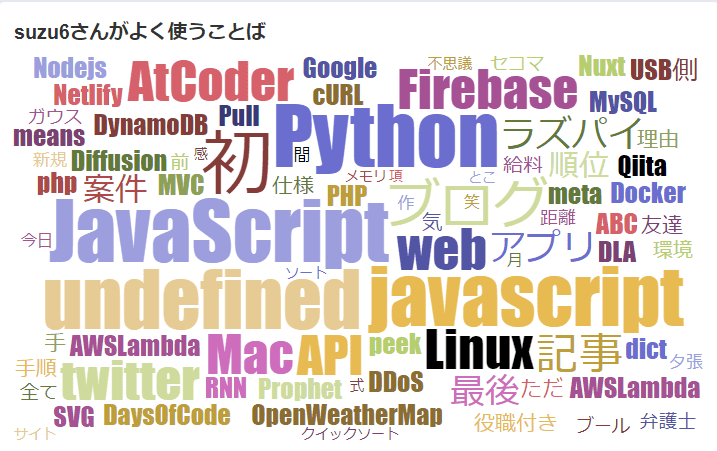
単語の出現頻度を表現する手法。 Twitterでよく見かけるかと思います。

whotwiというサービスで分析した、私のアカウント@suzu6_pyの頻出単語。 WEBエンジニアらしい単語ですね。
Word Cloudを使ってみる
まずはのamChartsのデモを見ながらWord Cloudを使ってみる。
めっちゃ動いている!!テキストエリアを変更してボタンRedrawをクリックすると、その文章で再描画できます。
theやandなどの助詞(?)が大きくなってしまうため、名詞や動詞に絞ると文章の特徴がわかりやすくなります。
初期値の文章はシートン動物記の狼王ロボ(Lobo, the King of Currumpaw)の冒頭一文を借りています。
日本語の対応
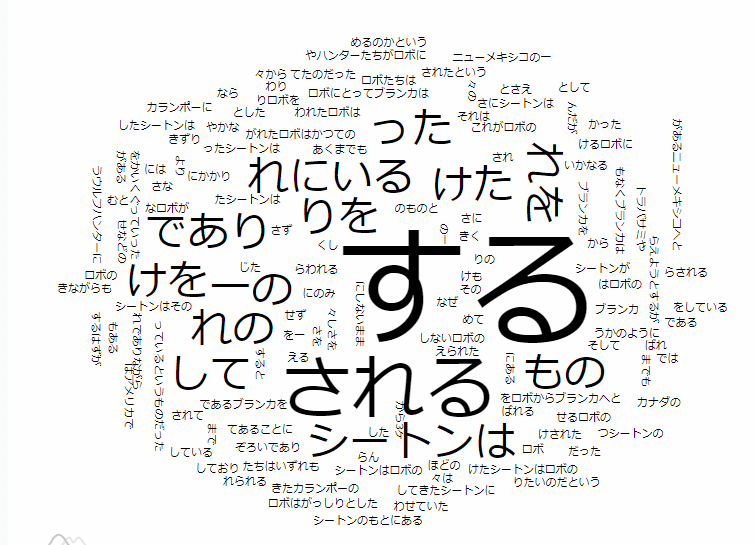
日本語にも対応しています。

狼王ロボ Wikiのあらすじを適用した図。
ところどころ単語の切り分けが上手くいってないようです。 ライブラリのアルゴリズムはスペースで区切っているだけだと思っていました。 しかし、日本語も出来ているので、形態素解析で単語に切り分けているのかもしれません。 別のライブラリを使って形態素解析を行えば、精度の良いWorld Cloudになりそうです。
コード
デモのコードを少し変えています。 テキストの取得などにはjQueryを使用しました。
<script src="https://code.jquery.com/jquery-3.3.1.slim.min.js" integrity="sha256-3edrmyuQ0w65f8gfBsqowzjJe2iM6n0nKciPUp8y+7E=" crossorigin="anonymous"></script>

<script src="https://www.amcharts.com/lib/4/core.js"></script>
<script src="https://www.amcharts.com/lib/4/charts.js"></script>
<script src="https://www.amcharts.com/lib/4/plugins/wordCloud.js"></script>
<script src="https://www.amcharts.com/lib/4/themes/animated.js"></script>
<script src="/images/posts/111/world-cloud.js"></script>


<!-- スタイル -->
<style>
#chartdiv {
  width: 100%;
  height: 500px;
}
</style>

<section class="section">

<!-- グラフの描画先 -->
<div id="chartdiv"></div>

<textarea name="text" class="textarea" placeholder="e.g. Hello world" row=20>CURRUMPAW is a vast cattle range in northern New Mexico. It is a land of rich pastures and teeming flocks and herds, a land of rolling mesas and precious running waters that at length unite in the Currumpaw River, from which the whole region is named. And the king whose despotic power was felt over its entire extent was an old gray wolf.  Old Lobo, or the king, as the Mexicans called him, was the gigantic leader of a remarkable pack of gray wolves, that had ravaged the Currumpaw Valley for a number of years. All the shepherds and ranchmen knew him well, and, wherever he appeared with his trusty band, terror reigned supreme among the cattle, and wrath and despair among their owners. Old Lobo was a giant among wolves, and was cunning and strong in proportion to his size. His voice at night was well-known and easily distinguished from that of any of his fellows. An ordinary wolf might howl half the night about the herdsman's bivouac without attracting more than a passing notice, but when the deep roar of the old king came booming down the canon, the watcher bestirred himself and prepared to learn in the morning that fresh and serious inroads had been made among the herds.</textarea>

<div class="has-text-centered">
    <button id="redraw" class="button is-primary is-rounded">Redraw</button>
</div>
</section>
$(window).on('load', function () {
    loadText();
    // ボタンクリック
    $('#redraw').on('click', function () {
        loadText();
    });
});

function loadText(){
    // テキストデータ
    var sentence = $('textarea[name="text"]').val();
    // 改行を半角スペースに変換
    sentence = sentence.replace(/\r?\n/g, ' ');
    // グラフ描画
    drawWorldCloud(sentence);
}


function drawWorldCloud(sentence) {
    // アニメーションテーマを使う
    am4core.useTheme(am4themes_animated);

    var chart = am4core.create("chartdiv", am4plugins_wordCloud.WordCloud);
    var series = chart.series.push(new am4plugins_wordCloud.WordCloudSeries());

    series.accuracy = 4;
    series.step = 15;
    series.rotationThreshold = 0.7;
    series.maxCount = 200;
    series.minWordLength = 2; // 最少頻度
    series.labels.template.tooltipText = "{word}: {value}";
    series.fontFamily = "Courier New";
    series.maxFontSize = am4core.percent(30);

    // 文字列を渡すだけ
    series.text = sentence;

    // カラフルになる。
    series.colors = new am4core.ColorSet();
    series.colors.passOptions = {}; // makes it loop

    // 配置が動くようになる
    setInterval(function () {
        series.dataItems.getIndex(Math.round(Math.random() * (series.dataItems.length - 1))).setValue("value", Math.round(Math.random() * 10));
    }, 10000)
}
World Cloudの描画部分はかなりすっきりと書けて良い。 プラグインを解析することで、日本語対応や助詞の排除ができそうです。
コードを少し解説
drawWorldCloud(sentence)の後半を少し解説します。
seriesはグラフの場合数値が入ります。
今回はamChartのプラグインを宣言しており、文字列をそのまま渡すだけで良いです。
そして、seriesにカラーを渡しカラフルにしました。
ColorSetの数以上に単語があるので、ループさせています。
最後にsetIntervalで定期的に配置を変えています。
中でやっていることは、単語のIndexの位置を変えることで配置を変えています。
合わせて読みたい
amCharts 4を使った感想はQiitaにまとめましたのでご覧ください。
また、時系列データなんかの可視化のため下の記事でも利用しています。